RUECO2Function
RUECO2Function calculates a daily carbon dioxide adjustment factor for radiation use efficiency (RUE) . The factor is designed to scale baseline RUE around a reference concentration of 350 ppm CO2 and is based on the Reyenga et al. (1999) approach implemented in APSIM NG.
Overview
This function returns a dimensionless multiplier, \(f_{CO2}\), that can be used by parent RUE or stomatal conductance models to account for elevated atmospheric CO2 effects on biomass production.
The implementation supports two photosynthetic pathways:
- C3 pathway: temperature-dependent compensation point formulation.
- C4 pathway: linear CO2 response.
The function depends on weather inputs for daily maximum temperature, daily minimum temperature, and atmospheric CO2 concentration.
Note
The daily mean temperature cannot be more than 46.5°C for C3 plants, as this is outside the valid range for C3 photosynthesis.
RUECO2Function will not throw an error if the CO2 level is less than 350 ppm (Reyenga et al. 1999).
Model Structure
This section describes how this model is positioned within the APSIM framework. It outlines the broader structural and computational components that define its role and interactions in the simulation system.
This model inherits structural and functional behaviour from the following core APSIM components:
Connections to Other Components
This section describes how the model interacts with other components in the APSIM Next Generation framework.
These connections allow the model to exchange information—such as environmental conditions, developmental stage, or physiological responses—with other parts of the simulation system. For a general overview of how model components are connected in APSIM, see the Connections Overview.
| Component | Model | Connection Type | Description |
|---|---|---|---|
| MetData | IWeather | Link | Supplies daily weather inputs used by the algorithm: \(T_{max}\), \(T_{min}\), and \(CO_2\). |
Model Variables
This section lists the key variables that describe or control the behaviour of this component. Some variables can be adjusted by the user to modify how the model behaves (configurable), while others are calculated internally and can be viewed as model outputs (reportable). For a general explanation of variable types and how they are used within the APSIM Next Generation framework, see the Model Variables Overview.
Configurable and Reportable Properties
| Property | Type | Description |
|---|---|---|
| PhotosyntheticPathway | string | Selects the calculation branch. Valid values are “C3” or “C4”. |
Read-Only Reportable Properties
No read-only properties are available for this function.
Events
This section describes the events associated with this component. Events are signals or notifications that indicate when a particular process occurs within the simulation, or when a component needs to respond to a change in another part of the system. Some events are listened for by this component to trigger its processes, while others are raised to inform other components about changes. For a general overview of how APSIM Next Generation uses events to coordinate processes between components, see the Events Overview.
Events Listened For
No events are listened by this function.
Events Raised to
No events are raised by this function.
Processes and Algorithms
This section describes the scientific processes and algorithms represented by this component. Each process corresponds to a biological, physical, or chemical mechanism simulated during a model time step. Where appropriate, equations or conceptual summaries are provided to explain how the process operates within the APSIM Next Generation framework.
Daily Mean Temperature
The daily mean temperature (\(T\)) is calculated as the average of the daily maximum and minimum temperatures:
\[ T = \frac{T_{max} + T_{min}}{2} \]
where \(T_{max}\) and \(T_{min}\) come from the linked weather component.
C3 Compensation Point
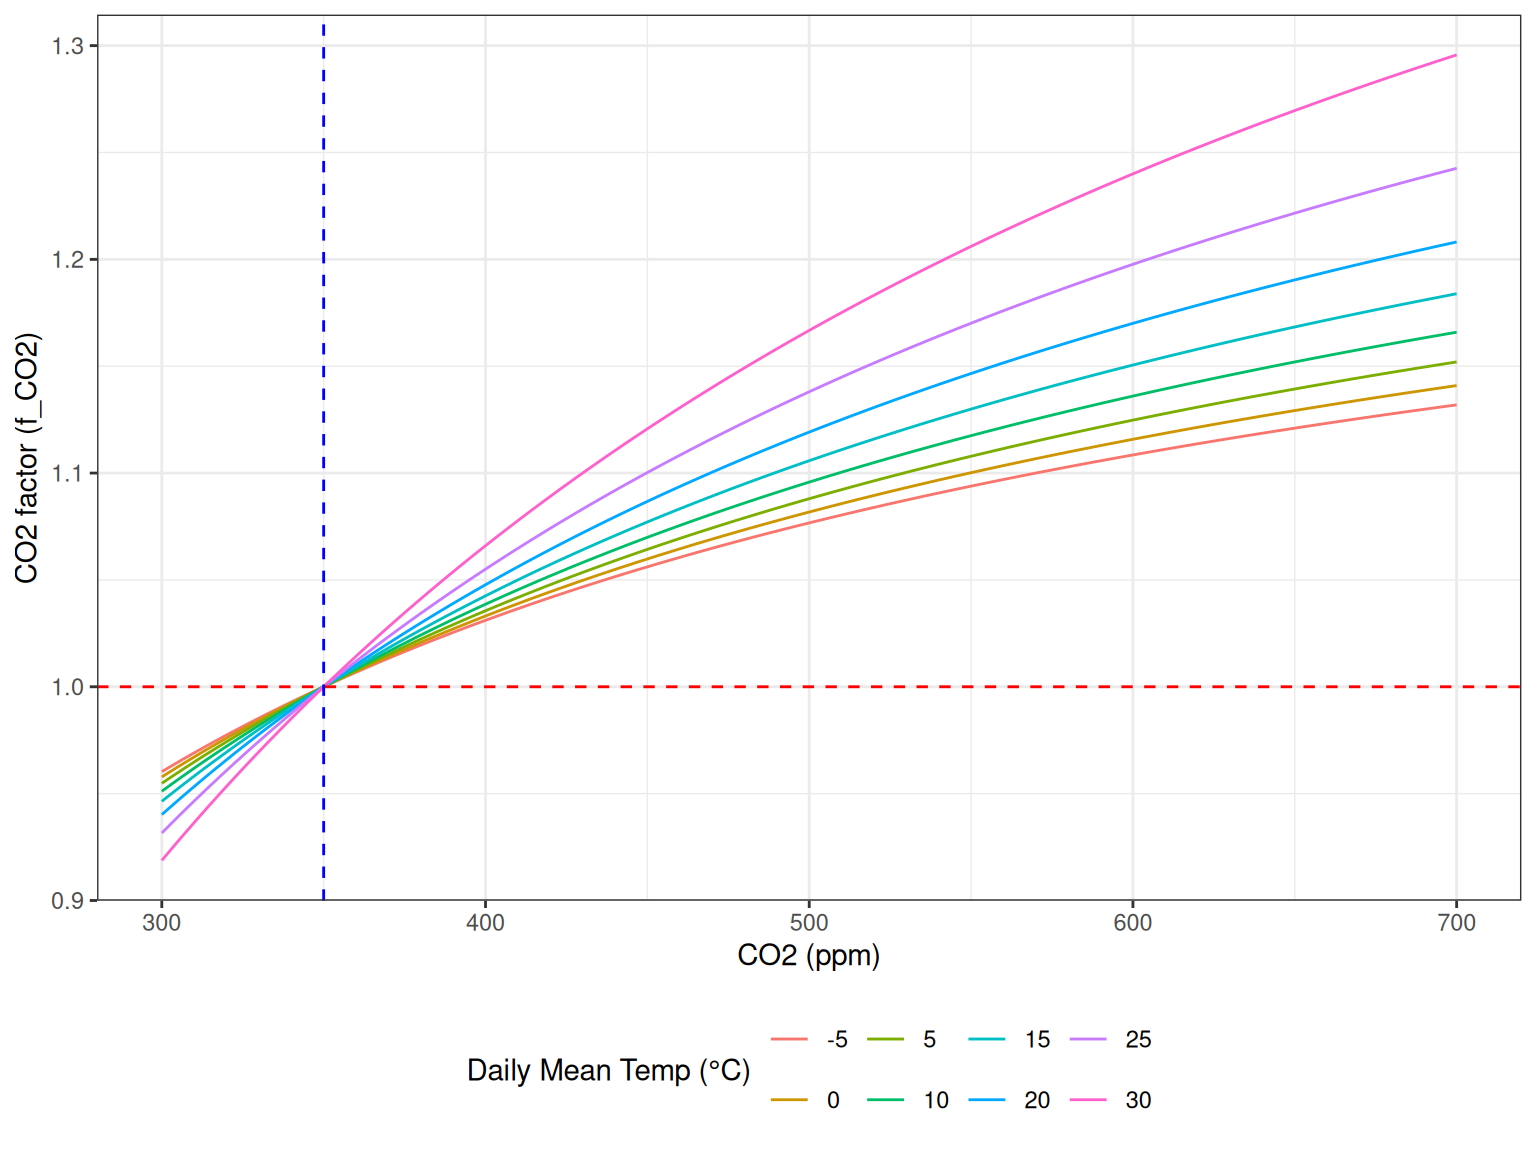
For C3 plants (like wheat), the \(CO_{\text{2}}\) factor is calculated by a function of environmental \(CO_{\text{2}}\) concentration (\(C\), ppm) and daily mean temperature (\(T\)) as published by (Reyenga et al. 1999).
\[ f_{CO2} = \frac{(C - C_i)(350 + 2C_i)}{(C + 2C_i)(350 - C_i)} \]
where \(C\) is the atmospheric CO2 concentration from the weather component. \(C_i\) is the temperature dependent compensation point (ppm) and is derived from the following function.
\[ C_i = \frac{163.0 - T}{5.0 - 0.1T} \]
When daily mean temperature \(T\) is above 46.5°C, the function throws an error as this is outside the valid range for C3 photosynthesis.
When \(C\) is at or below \(C_i\), the function returns an error as this indicates CO2 levels are too low for net photosynthesis.
C4 Linear Response
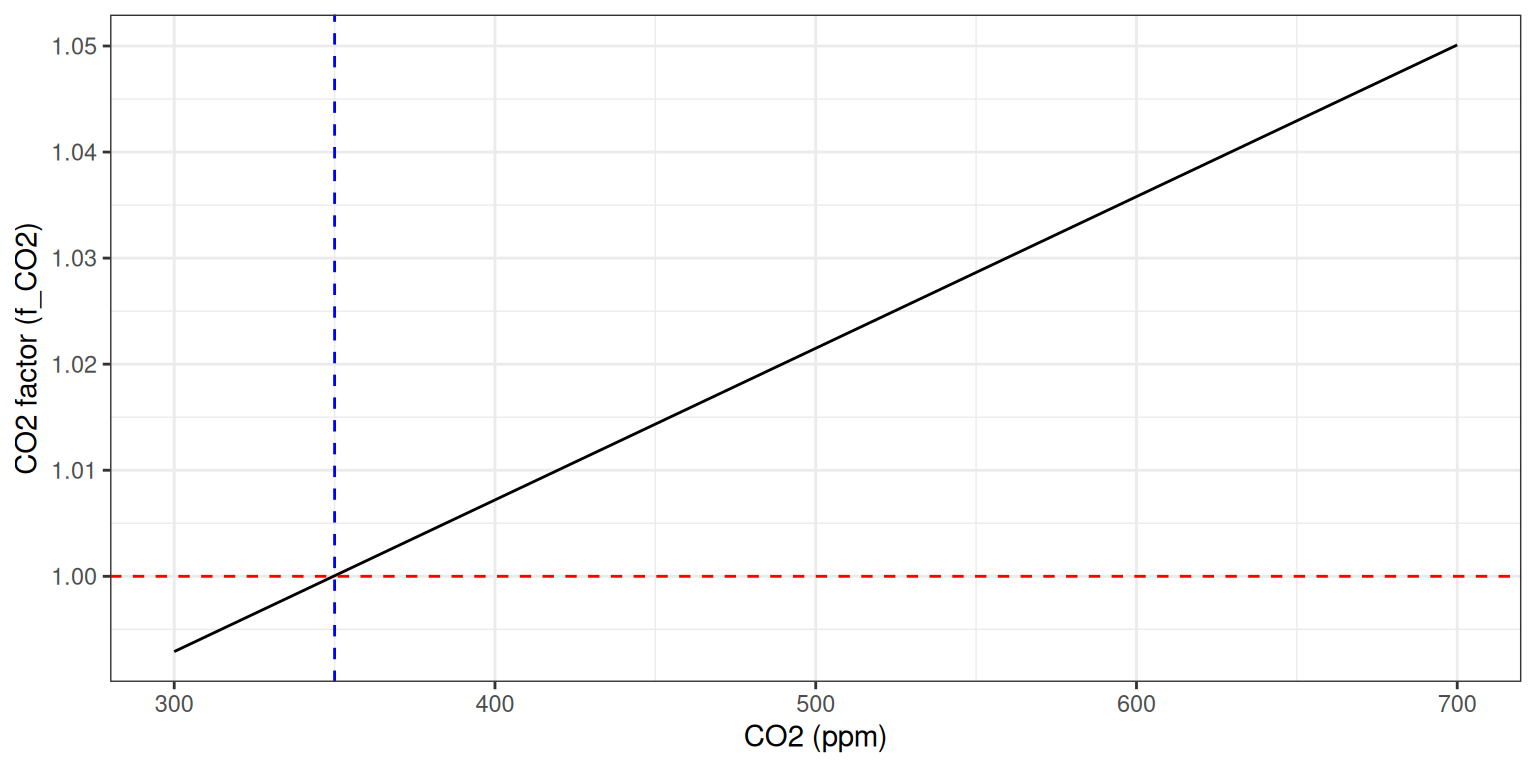
For C4 crops (e.g. Rice), CO_2 factor is increasing with CO2 concentration (\(C\), ppm) with a factor (\(f_{c}\)) according personal communications with Mark Howden.
\[ f_{CO2} = 0.000143 \times C + 0.95 \]
Cultivar-Specific Parameters
RUECO2Function has one direct configuration parameter that can vary by cultivar setup:
| Parameter | Typical cultivar use |
|---|---|
| PhotosyntheticPathway | Set to “C3” for cultivars/species with C3 photosynthesis (for example wheat) and “C4” for C4 types (for example maize). |
No cultivar-specific numeric coefficients are defined directly in this class. Cultivar effects are represented primarily through pathway choice and through other cultivar parameters in linked growth components.
User Interface
RUECO2Function can be added as a child of an IFunction parent in the model tree. Right-click the parent node, select Add Model…, and search for RUECO2Function in the filter box.
Practical Example
C3 plants
The CO2 factor for RUE in C3 plants increases with CO2 concentration and is also influenced by temperature through the compensation point. At 350 ppm CO2, the factor is around 1.0, but it can increase to around 1.2 at 700 ppm CO2 depending on temperature.
C4 plants
For C4 plants, the CO2 factor increases linearly with CO2 concentration. At 350 ppm, the factor is around 1.0, and it can reach around 1.1 at 700 ppm.
See Also
- Source code: RUECO2Function.cs on GitHub
References
Reyenga, P. J., S. M. Howden, H. Meinke, and G. M. McKeon. 1999. “Modelling Global Change Impacts on Wheat Cropping in South-East Queensland, Australia.” Environmental Modelling & Software 14 (4): 297–306. https://doi.org/10.1016/S1364-8152(98)00081-4.